

Summary
After you have completed the initial setups required to create Ad-Hoc reports, you can follow the steps below to create a detailed check approval report.
NOTE: The Ad-Hoc Reporting tool offers a number of powerful reporting options that are not currently supported by the Accela Support team. Questions regarding simple report creation can be directed to Accela Support, but complicated reports with multiple table joins may not be supported.
Related Links
Click here for an Ad-Hoc Reporting Overview.
Click here for information on Reporting Role Maintenance.
Click here for information on Creating Simple Ad-Hoc Reports.
Step by Step
Open Ad-Hoc Reporting and click on the New button at the top to start a new report.

The window that will open will include every table available in the Springbrook system. Information about tables and fields can be obtained by using the Table/Field functionality in Springbrook or the Data Dictionary. Click here for information on Table/Field Help.
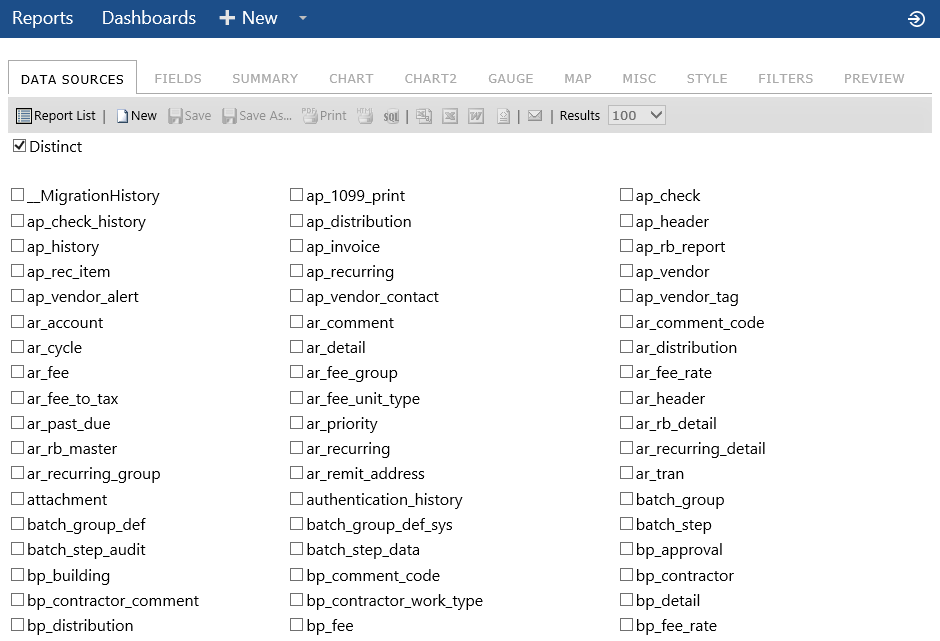
When you select a field in this window, other fields will gray out and not be available. That is because the table cannot automatically link the tables to avoid duplicate results. That does not mean you cannot use the tables together, just that you need to add them and manually link (join) the tables. Scroll to the bottom and click on the Advanced button  to add tables individually. This will open the Advanced Data Sources view.

Select tables for your report from the Data Sources (Tables and Views) drop-down list.
You can add a table either above or below the other tables by clicking on the Insert Above  and Insert Below
  buttons to the right of the field. If you add the table above it will link to the table in the current line without having to select it.
All tables in the database will be listed. If you type in the first letter of the system (“g” for gl) it will take you to that letter.
You can add all the tables before assigning the links/joins or assign them as you go. The reporting tool will always try to link using id but that is rarely the correct field to use.
In the case below, the data source was added above the prior field. Notice it set to link to AP vendor rather than AP history from the top line.
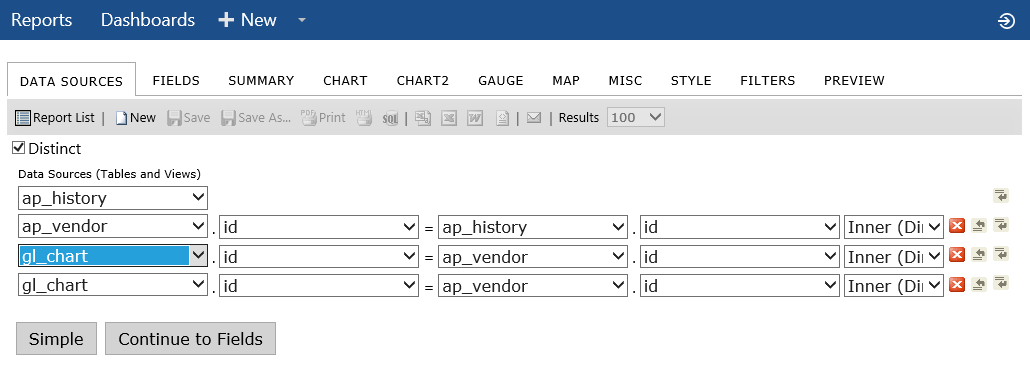
As with many tables in Springbrook, to link to the gl_chart table you will need multiple links. You must link to the fiscal_year and each section of your account number. This example database has three sections to the account number, so this report needs to link to each of those sections. If you have six or seven sections, each will need to have a link to all sections to avoid duplicated entries on the report.
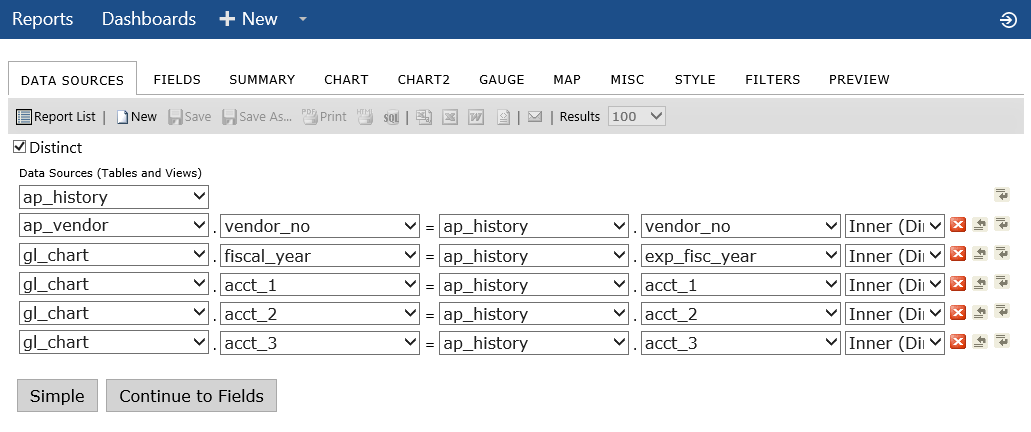
Once the tables and links are mapped, click the Simple button  . That will return you to the initial window displaying all the tables. Scroll to the bottom and click the Advanced button
  again. This will open the Advanced Data Sources view again, but the window will change in an important way.
Notice in the screenshot below that the gl_chart table has all but one of the entries “grayed” out. You can still relink the fields as above, but now the multiple links will be assigned to the same table. This process is only needed if you have created multiple links to the same table. This allows you to create complex reports.
NOTE: The Ad-Hoc Reporting tool offers a number of powerful reporting options that are not currently supported by the Accela Support team. Questions regarding simple report creation can be directed to Accela Support, but complicated reports with multiple table joins will not be supported.
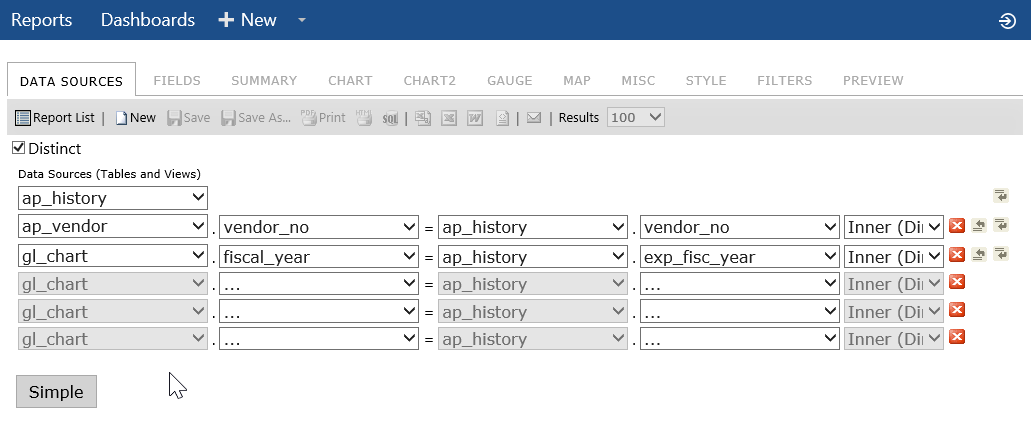
Reassign the fields to link the tables and click the Continue to Fields button  .
.
Click the Field drop-down to add the fields individually or use the Quick Add button  to add several at the same time.
When adding fields individually, scroll to the table you want and select the fields you want to include. All tables selected as data sources will display in alphabetical order.

The Quick Add option provides a way to view all tables and fields and to select multiple fields at the same time. You may need to scroll down to find all the desired fields. You should ONLY see gl_chart or any table listed one time. If you see a table listed multiple times, you need to back up to the data source step to avoid errors.
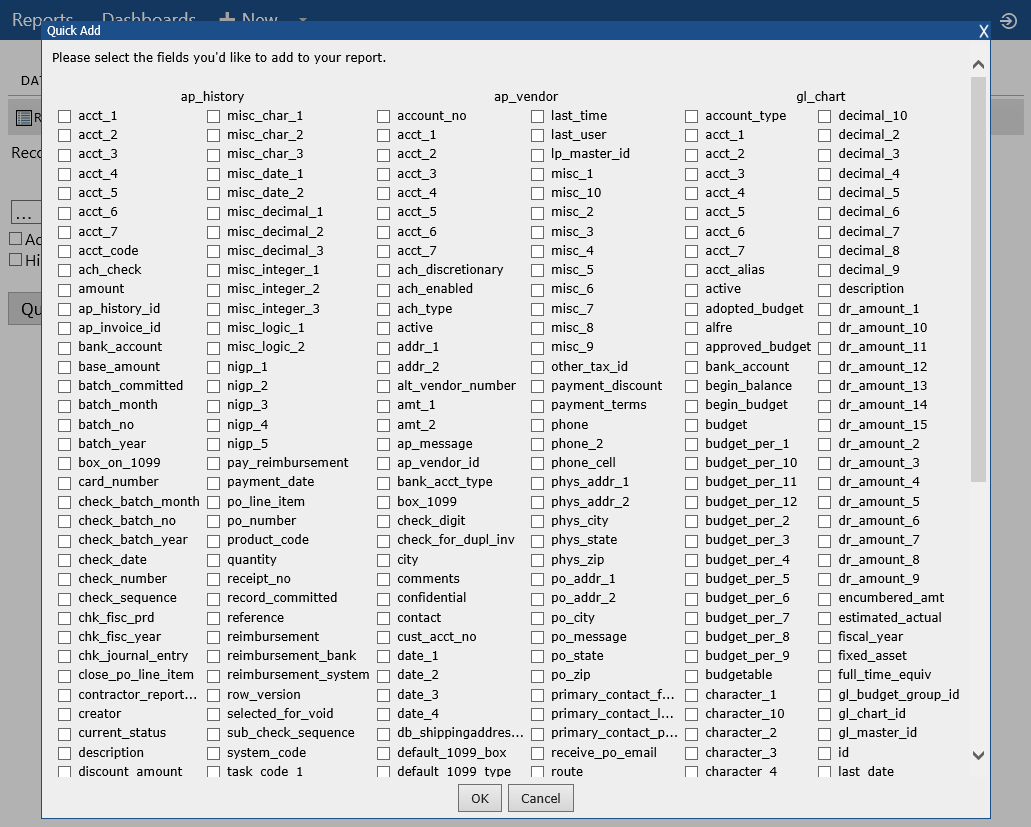
Click OK when the field selection is complete. You can always add more fields to the report later.
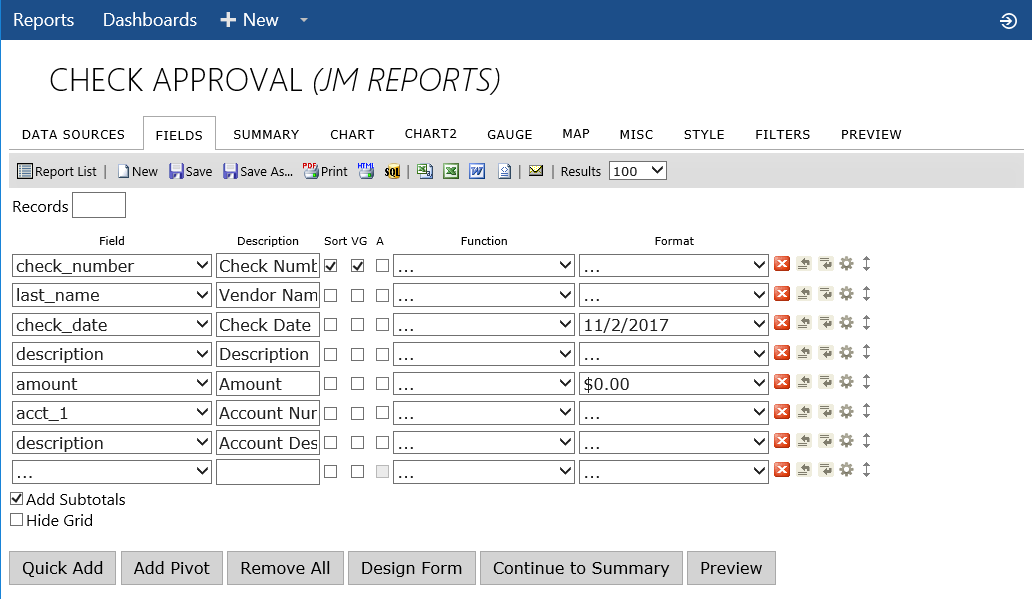
Remember to save the report often. If you click on Report List or New while working on an unsaved report, your entire configuration will be lost without warning. When saving you can set up a Category or leave it without any grouping.
Now you can modify the fields and put them in s different order.
| Function Name | Description |
| ... | No function used |
| Average | Average the values in a column |
| Count | Counts the number of values in a column |
| Maximum | Takes Maximum value of a field |
| Minimum | Takes Minimum value of a field |
| Sum | Sums the values in a column |
| Sum Distinct | Sums the rows with distinct values in a column |
| Group | Groups field values together for aggregating |
| Group(Day) | 23; day of month |
| Group(Month) | 7; month of year |
| Group(Year) | 2012 |
| Group(Month Name) | July |
| Group(Date) | 7/4/2012 |
| Group(Day of Week) | Sun or Mon |
| Group(Year & Month) | 2012 - 07 |
| Group(Year & MN) | 2012 - Jul |
| Group(Week) | Jul 01 - Jul 07 (Sunday to Saturday of Week) |
| Group(Year & Quarter) | 2012–Q3 |
| Days Old | 342 (Number of Days from Today’s Date) |
| Sum(Days Old) | 782 (Sums the Number of Days from Today's Date) |
| Format | Description | Examples |
| . . . | Displays the number as it is stored in the database | 500 |
| 0,000 | Displays as a whole number | 500 |
| 0,000.00 | Displays with two decimal places | $500.00 |
| $0.00 | Displays as currency with two decimal places | $500.00 |
| $/100 | Displays the Number / 100 In currency format. | $5.00 |
| 0.0 | Displays with one decimal place | 500.0 |
| 0.00 | Displays with two decimal places | 500.00 |
| 0.000 | Displays with three decimal places | 500.000 |
| 0% | Displays the number as a percentage | 50000% |
| % of Group (with rounding) | Same as % of Group but rounds to closest tenth (ex. 1.11547% would be 1.1%). | 100.0% (only one selected value, 500) |
| % of Group | Calculates the percentage of the row value to the entire group of values. | 100% |
| Gauge | Shows value in a Linear Gauge instead of a numerical value. This value is fixed between 0 and 1, similar to the percentage formatter. | |
| Gauge (variable) | Shows values in a Linear Gauge which changes range based on subsequent values. The formatted field supplies the value to be gauged, the next two numerical fields establish (respectively) the lower and upper boundaries of the gauge. This gauge only operates in a range based on significant digits, so 0 to 100, 10 to 10,000, 100 to 10,000, etc. |

|
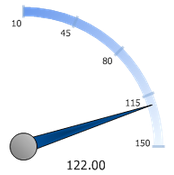
| Dash Gauge | Shows values in a Radial Gauge style with a range based on the higher number of significant digits - so a value of 1,043 will produce a range from 0-10,000, a value of 10,430 will produce a range of 0 to 100,000, etc. |
|
| Format | Description | Examples |
| . . . | Displays the date as it exists in the database | 7/4/2012 12:00:00 AM |
| Short Date | Displays date using the mm/dd/yyyy format | 7/4/2012 |
| Long Date | Displays the day of the week, month, numeric day, and the year | Wednesday, July 04, 2012 |
| Short Time | Displays time as hh:mm AM/PM | 12:00 AM |
| Long Time | Displays time as hh:mm:ss AM/PM | 12:00:00 AM |
| Full(short) | Displays the Long Date format, followed by the Short Time format | Wednesday, July 04, 2012 4:34 PM |
| Full(long) | Displays the Long Date format, followed by the Long Time format | Wednesday, July 04, 2012 4:34:52 PM |
| D&T (short) | Displays the Short Date format, followed by the Short Time format | 7/4/2012 4:34 PM |
| D&T (long) | Displays the Short Date format, followed by the Long Time format | 7/4/2012 4:34:52 PM |
 – Deletes the field from the report.
 – Inserts a field above the selected row.
 – Inserts a field below the selected row.
 – Opens the Advanced Properties window. See screenshot below for more information. Once an advanced property has been set on a field, the button will update to include a green check mark
  .
. – Allows you to click and drag the field to a different vertical position. When dragging a field watch for the blue line to appear. That will indicate you have the field in the desired location.
Advanced Field Settings
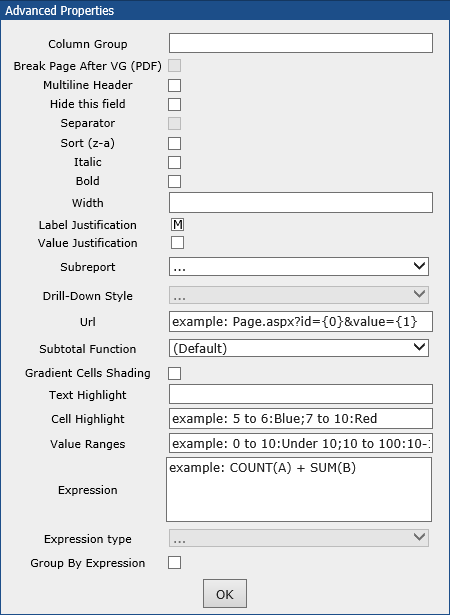
Note: Only those advanced functions used for this example report are listed below.
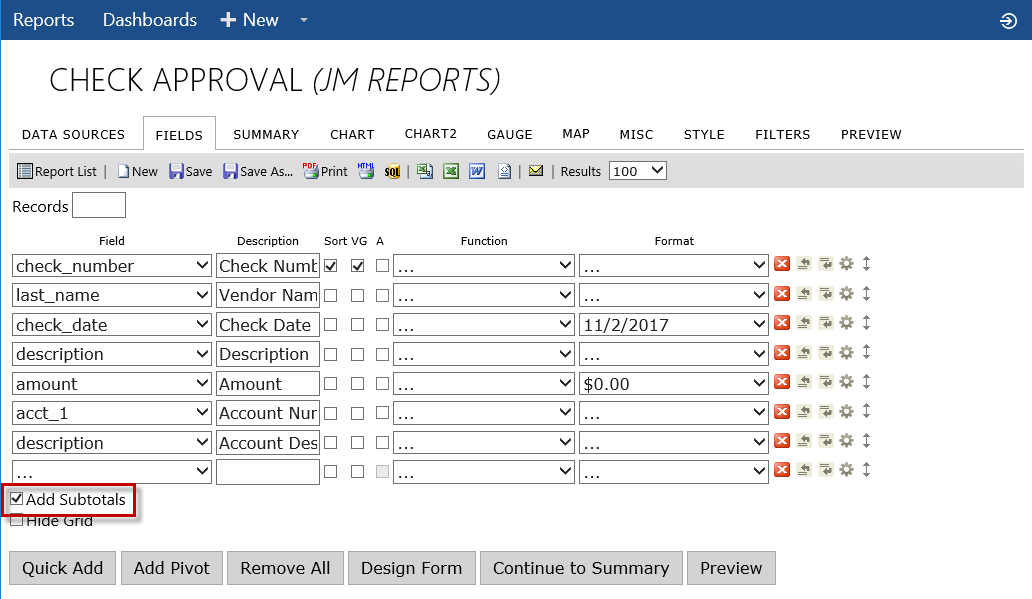
Check the Add Subtotals toggle to include the total for the group.
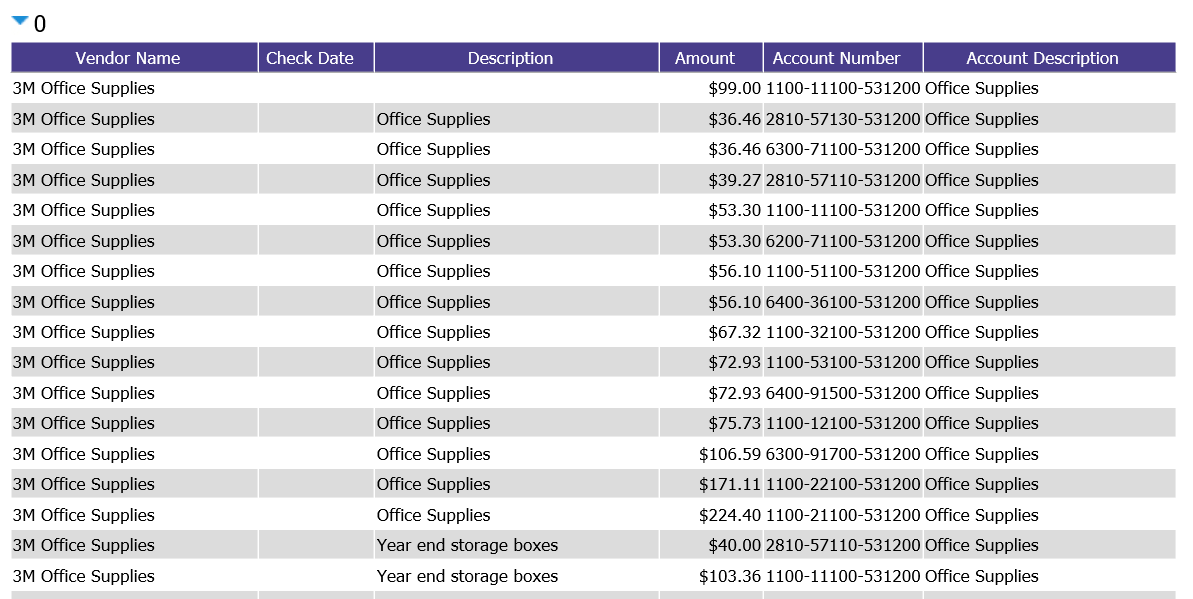
Finally, confirm the report meets your needs by clicking the Preview button  to preview the report.
® All Rights Reserved 2017
Toll Free Support 866-777-0069